This website uses cookies so that we can provide you with the best user experience possible. Cookie information is stored in your browser and performs functions such as recognising you when you return to our website and helping our team to understand which sections of the website you find most interesting and useful.
Certificate Course in Data Analytics Using R
Learn from
India's Top Ranked
Institute

Ranked 12 in MHRD-NIRF*
*National Institutional Ranking Framework
Accredited with the highest NAAC* ‘A++’ grade*
*National Assessment and Accreditation Council
Globally ranked 4-Star university with a ‘Diamond’ rating by QS-IGAUGE India
*QS World University Rankings
Why Choose this Program?
Comprehensive
Curriculum
Curriculum designed by leading academicians and industry experts
Immersive Online
Learning Experience
LIVE Online Learning designed for Working Professionals
Taught by India’s top management faculty
Student Support
Services
AI Based Students Support, 24*5 Chat Support, Comprehensive Helpdesk Support

Why Choose This Course?
Gain in-demand R programming skills with hands-on projects and expert guidance. Learn data analysis and visualization, and earn a globally recognized certification from SRM. With flexible online learning, you can study at your own pace while building a strong portfolio.
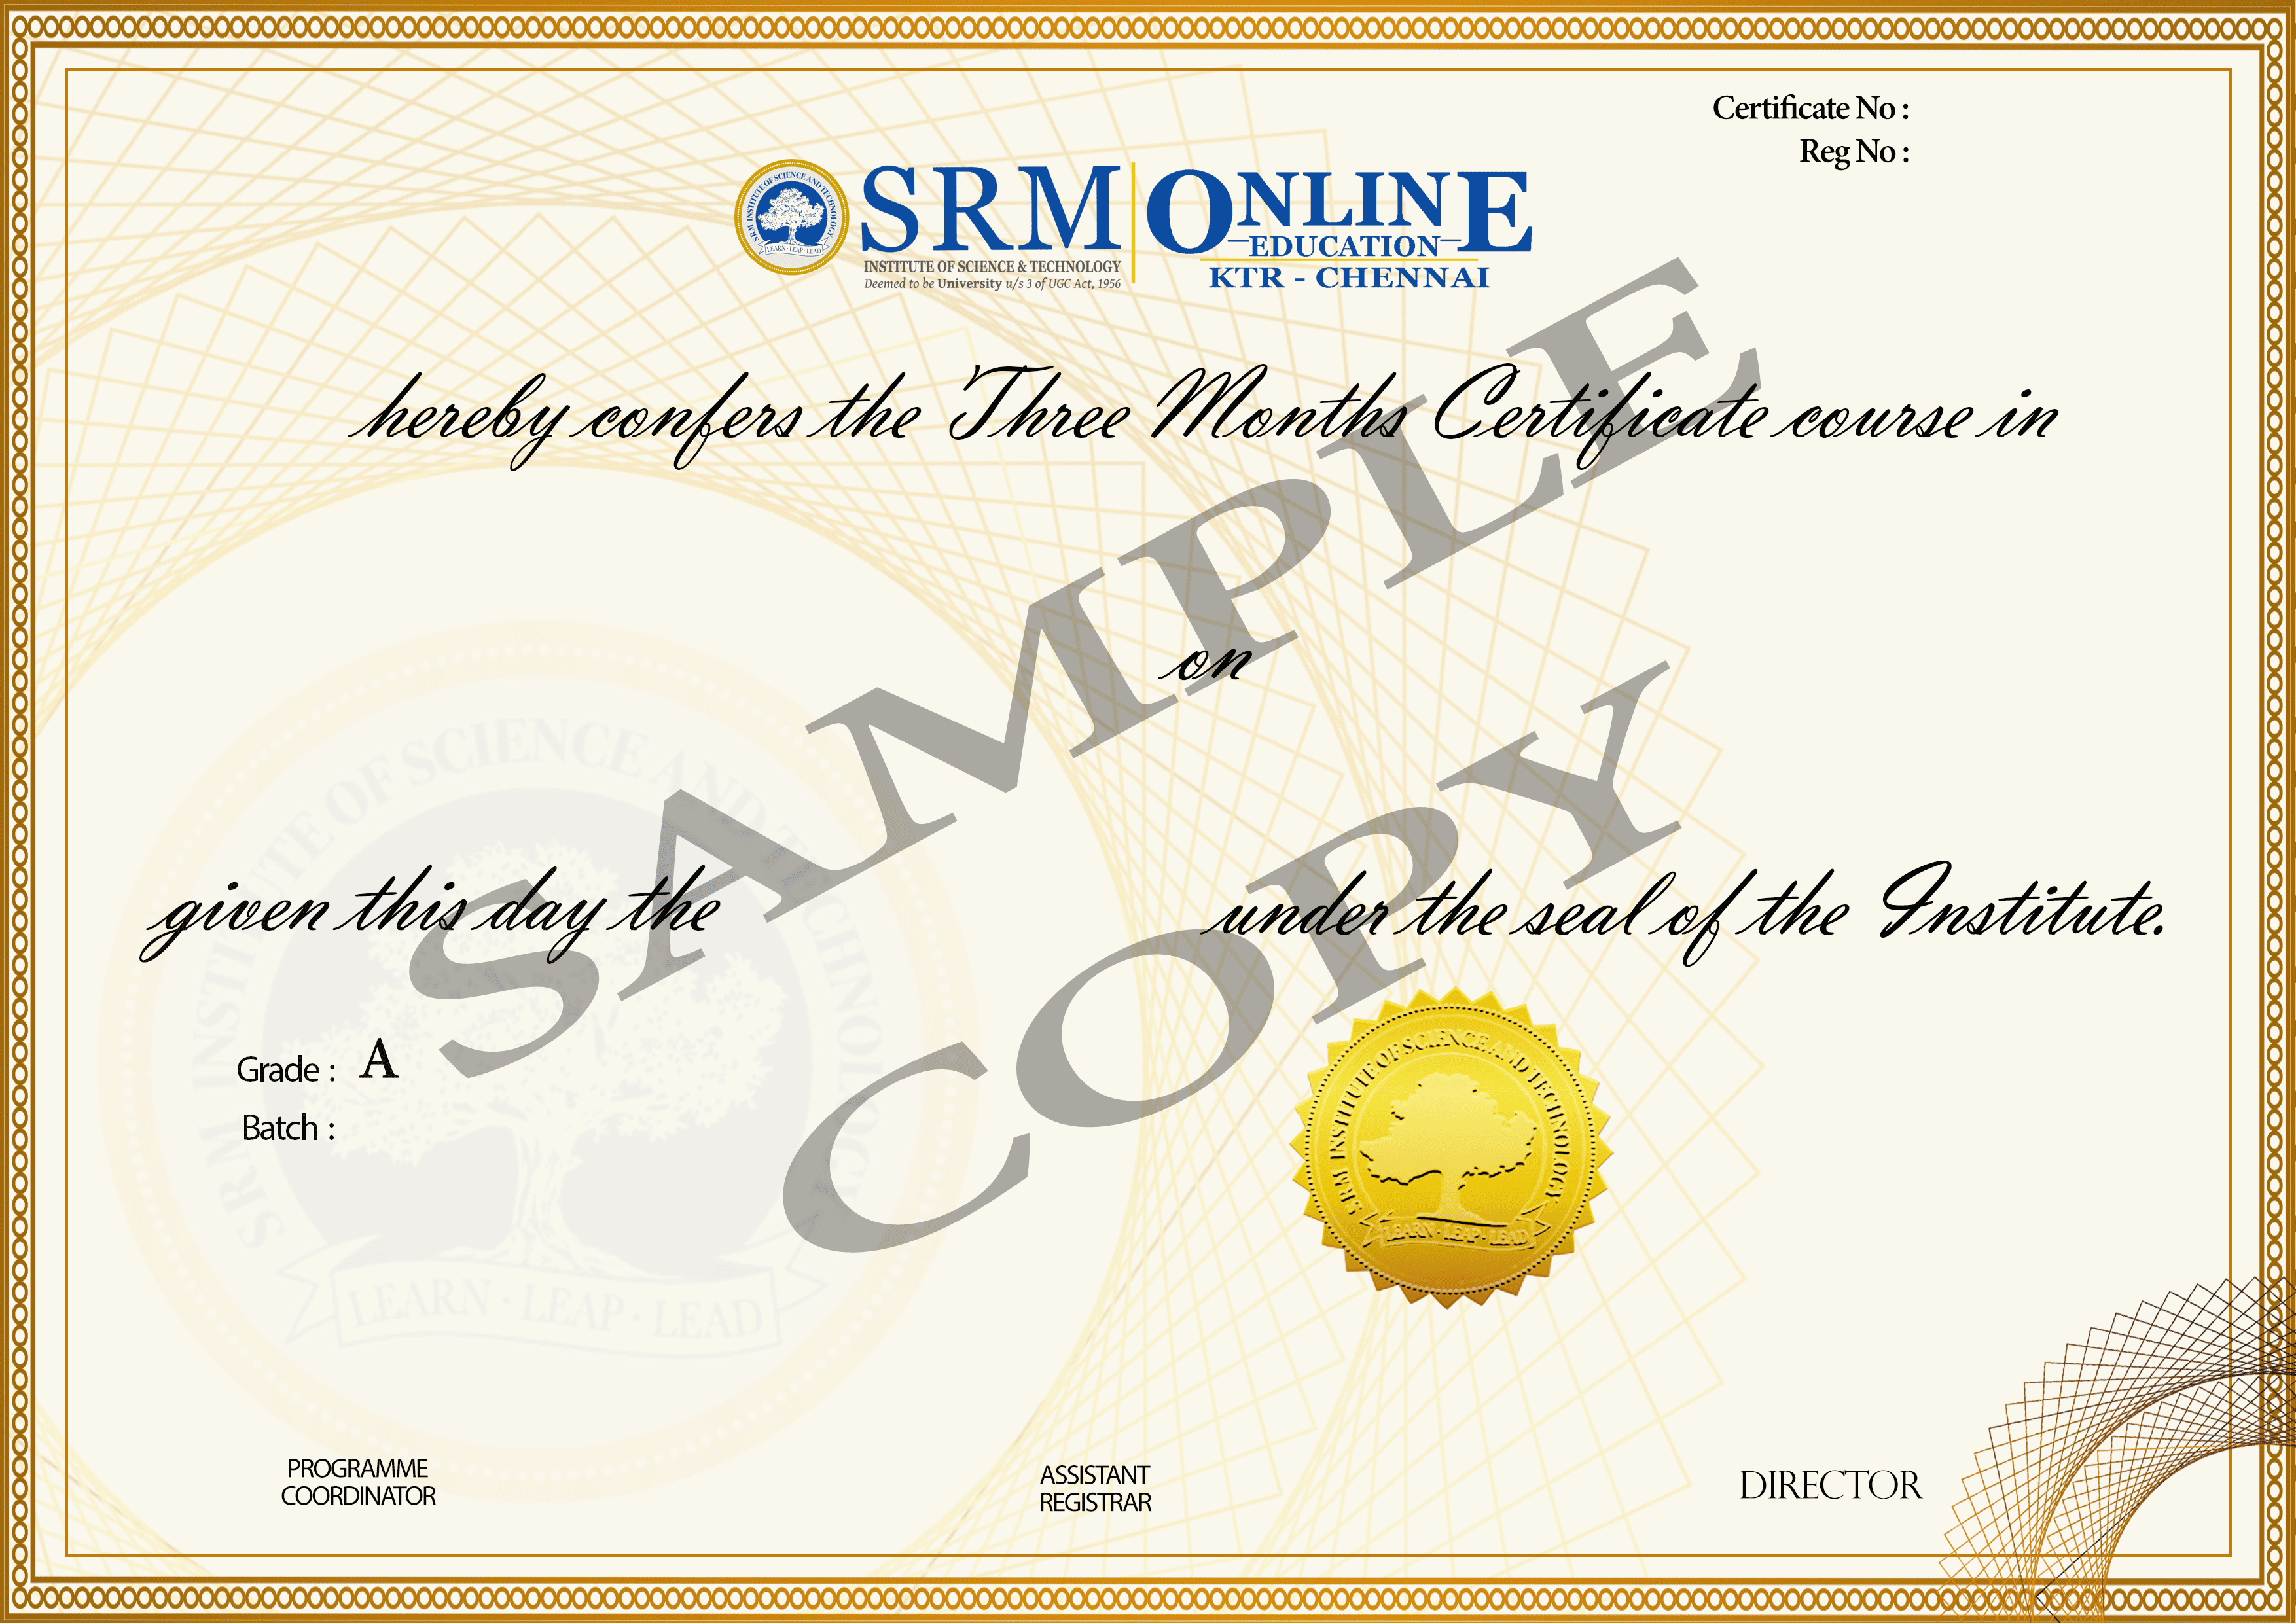
Certificate Course from SRM
Programme Fee
Domestic Structure
Online Learning
7000* / 3 Months
International Structure
Online Learning
$ 125* / 3 Months
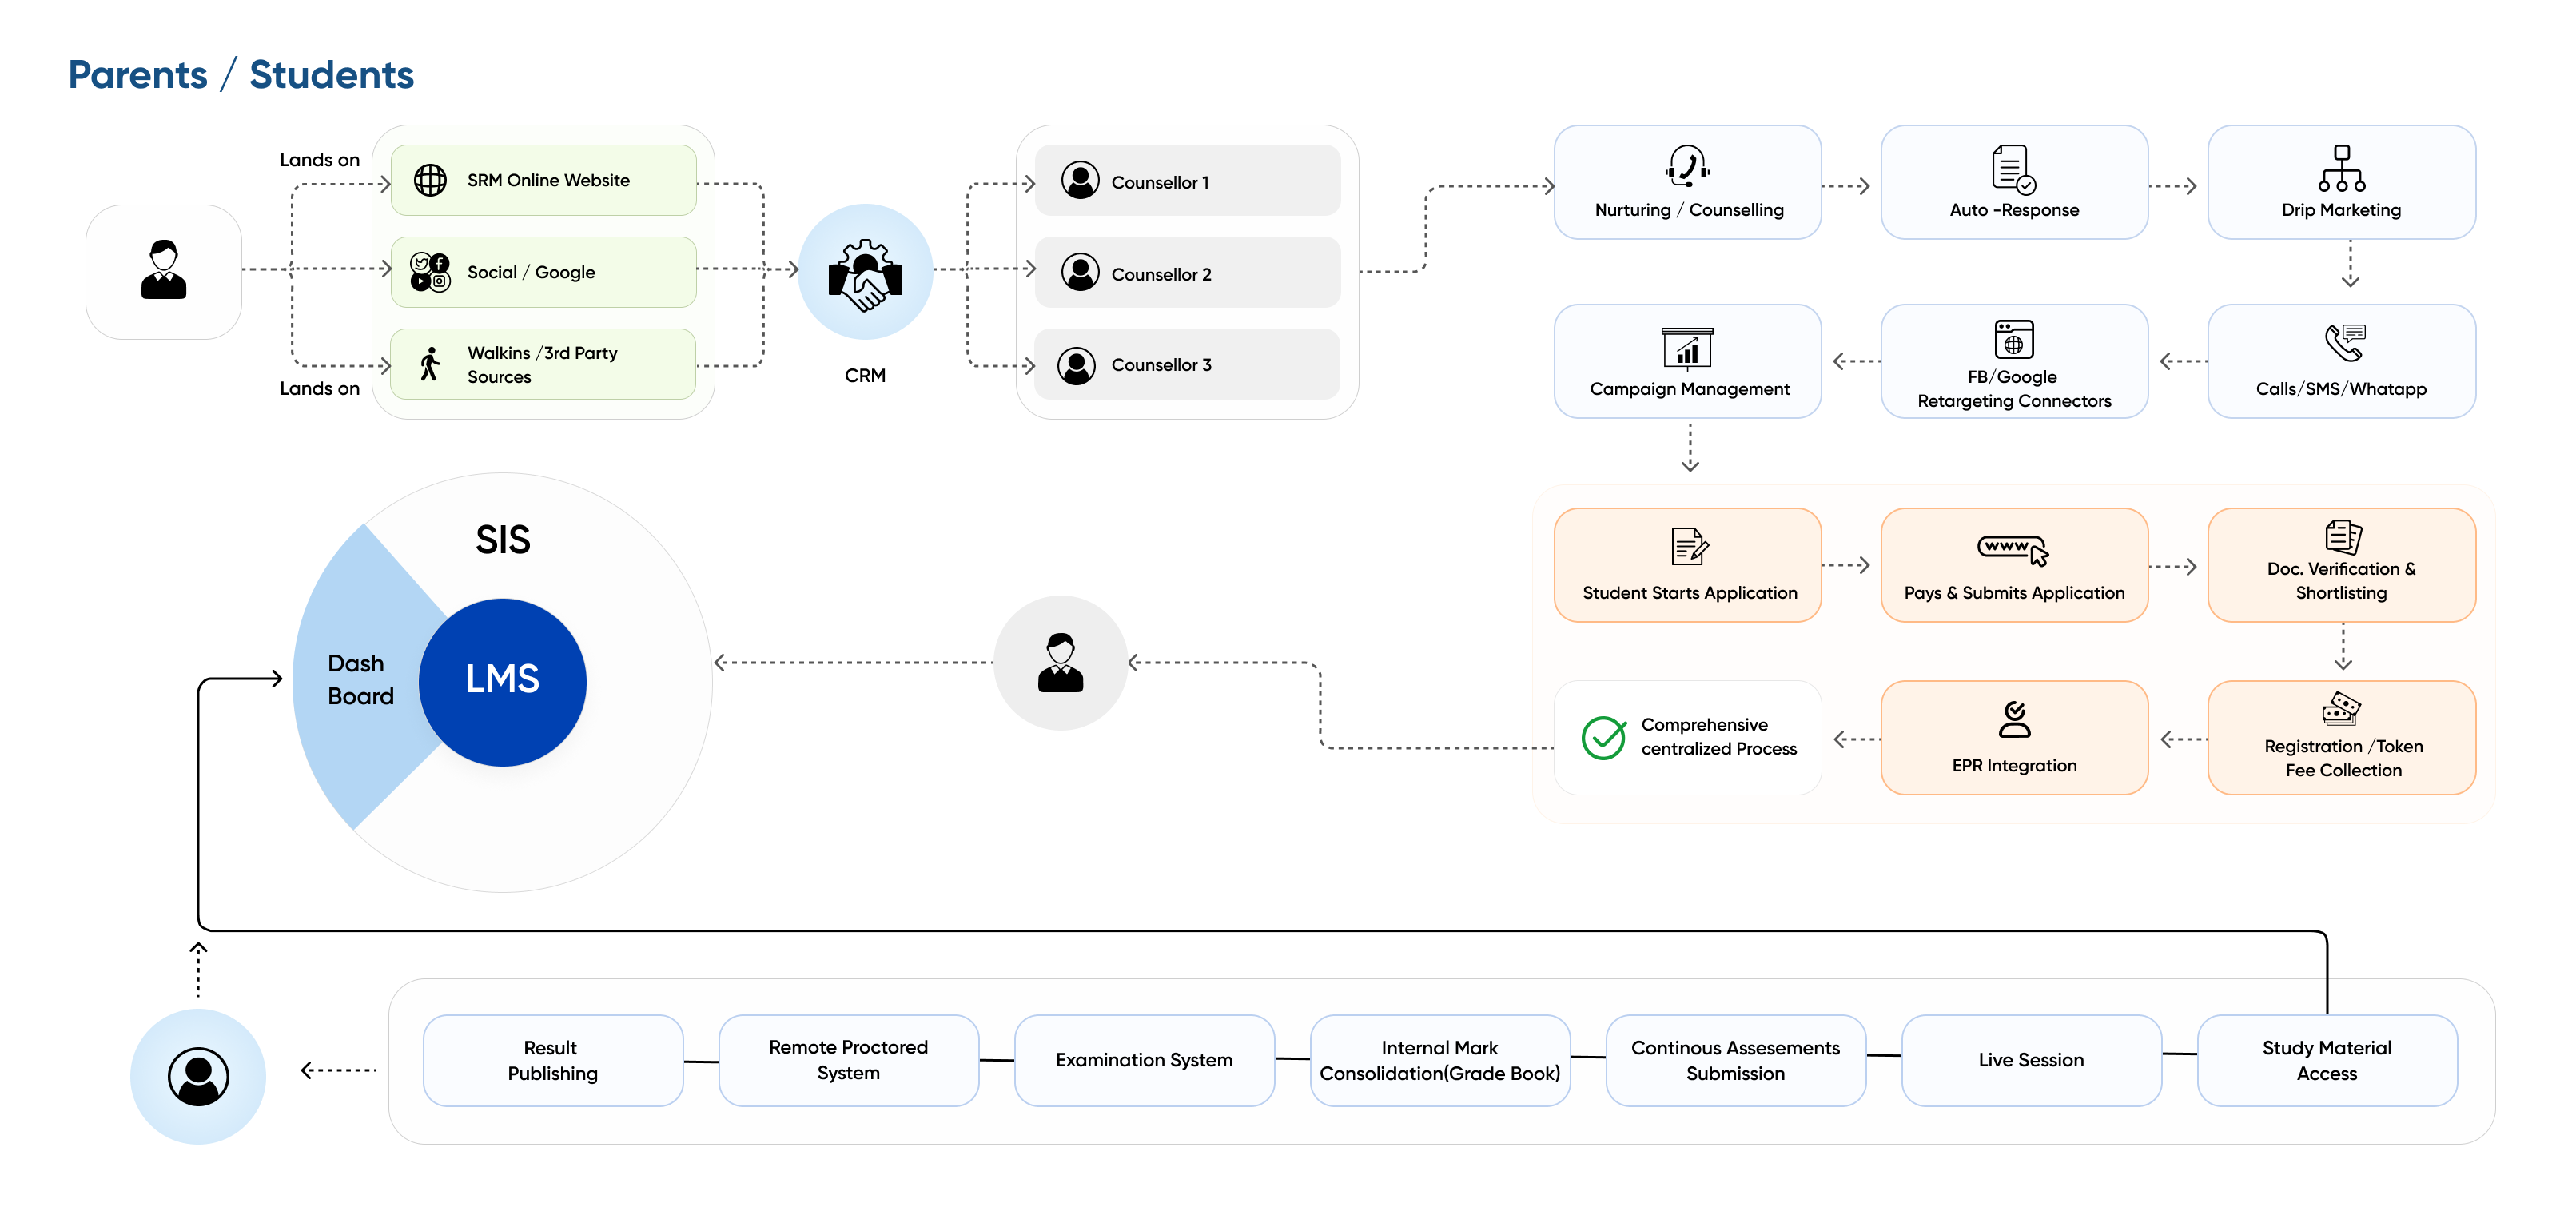
Students Gateway
Learn from one of the best management schools in India
Live Online Learning | UGC Entitled | AICTE Recognized | Category One University
A Data Analytics using R Certificate Course is designed to equip participants with essential skills in using R, a powerful statistical computing and graphics language, for data analysis. This course typically covers data manipulation, statistical analysis, data visualization, and machine learning techniques, making it ideal for individuals seeking to gain expertise in data analytics using R.
A certificate course on "Data Analytics using R" can be a great way to introduce students and professionals to the power of R for data analysis. Here's an overview of what such a course might cover, along with details on eligibility.
-
Introduction to R
- Overview of R and RStudio
- Installation and setup
- Basic syntax and operations
- Data types and structures (vectors, lists, data frames, matrices)
-
Data Import and Export
- Reading data from various sources (CSV, Excel, databases)
- Writing data to files
- Handling missing data
-
Data Manipulation
- Using dplyr and tidyr for data manipulation
- Filtering, selecting, and transforming data
- Summarizing and grouping data
-
Common Classification Algorithms
- Decision Trees
- Random Forest
- Support Vector Machines (SVM)
- K-Nearest Neighbors (KNN)
- Naive Bayes
-
Data Visualization
- Introduction to ggplot2
- Creating basic plots (histograms, scatter plots, box plots)
- Customizing plots (themes, labels, annotations)
- Advanced visualization techniques
- Regression analysis (linear and logistic regression)
-
Data Cleaning and Preprocessing
- Data normalization and transformation
- Encoding categorical variables
-
Advanced Topics
- Clustering techniques
- K – means Algorithm
- Hierarchical Algorithm
-
Tools and Packages
- Introduction to popular R packages (caret, shiny, plotly)
The course is typically designed for:
- Students :
- Undergraduate or graduate students in fields such as computer science, statistics, engineering, business, economics, or any related discipline.
- Basic knowledge of mathematics and statistics is recommended but not mandatory.
- Professionals:
- Data analysts, statisticians, business analysts, or anyone looking to enhance their data analysis skills.
- Professionals from non-technical backgrounds seeking to transition into data analytics roles.
- Researchers and Academics:
- Researchers who want to leverage R for statistical analysis in their projects.
- Academics interested in incorporating R into their curriculum or research methodology.
+12 from any recognized board including NIOS, or any degree with a pass with 50% in the qualifying exams.
Our Program Advantage
Learn from a comprehensive curriculum taught by world-class faculty. Get guidance on your learning journey, and access career services.

CONVENIENT LEARNING FORMATS
Live Online Learning

PROGRAMME BENEFITS
Real-World Class Students

MAXIMUM FLEXIBILITY
Week – End Live Interactive Session
What You'll Learn
Data Analytics Using R
-
Basics of R programming and data manipulation.
-
Statistical modelling and predictive analysis.
-
Data visualization techniques using R.

Program Highlights
Data Analytics Using R
-
Interactive sessions with industry experts.
-
Hands-on assignments and practical exposure.
-
Certification for skill validation

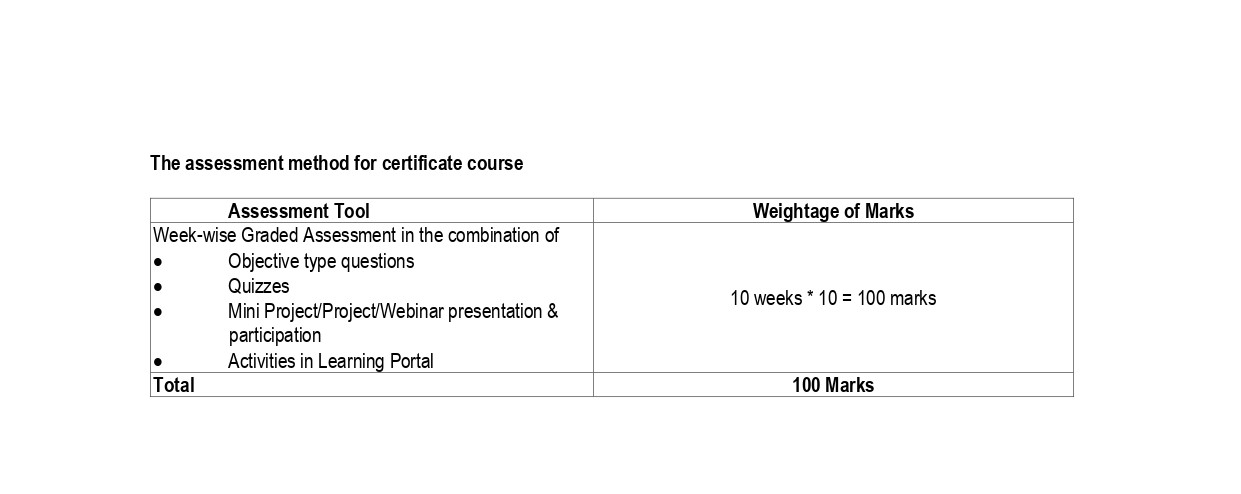
Admission Process
Step - 1
Application submission + Upload of
Step - 2
Selection Process
Step - 3
Selection intimation and fee payment
Step - 4
Formal enrolment of the program

