This website uses cookies so that we can provide you with the best user experience possible. Cookie information is stored in your browser and performs functions such as recognising you when you return to our website and helping our team to understand which sections of the website you find most interesting and useful.
Business Analytics using Power BI
Learn from
India's Top Ranked
Institute

Ranked 12 in MHRD-NIRF*
*National Institutional Ranking Framework
Accredited with the highest NAAC* ‘A++’ grade*
*National Assessment and Accreditation Council
Globally ranked 4-Star university with a ‘Diamond’ rating by QS-IGAUGE India
*QS World University Rankings

Why Choose This Course?
- Gain in-demand skills in data visualization and business analytics
- Learn how to make data-driven decisions using Power BI
- Enhance career prospects in business intelligence and analytics
Certificate Course from SRM

Programme Fee
Domestic Structure
Online Learning
7000* / 3 Months
International Structure
Online Learning
$ 125 * / 3 Months
Students Gateway

Learn from one of the best management schools in India
Live Online Learning | UGC Entitled | AICTE Recognized | Category One University
This certificate course provides a comprehensive introduction to Business Intelligence (BI) and data analytics using Microsoft Power BI. Designed with practical learning in mind, the course equips learners with the skills to collect, transform, analyze, and visualize data to support strategic decision-making. Through hands-on sessions and real-time datasets, participants will learn to create interactive dashboards and gain insights from data effectively.
- Introduction to Power BI & Data Visualization
- Data Preparation and Transformation
- Data Modeling and DAX Basics
- Basic Reports and Dashboards
- Advanced DAX and Calculations
- Advanced Data Modeling
- Power BI Service and Collaboration
- Advanced and Custom Visualizations
- AI and ML Integration in Power BI
- Power BI and Big Data Integration
This course is ideal for:
- Students from Commerce, Computer Science, Data Science, and Management streams
- Working professionals interested in data analytics and reporting
- Business analysts and aspiring data professionals
- Entrepreneurs and managers who rely on data-driven decision-making
- Anyone with basic computer skills and an interest in data visualization

+12 from any recognized board including NIOS, or any degree with a pass with 50% in the qualifying exams.
What You'll Learn
Business Analytics using Power BI
-
Data processing and visualization
-
Creating reports and dashboards
-
Business intelligence techniques using Power BI

Program Highlights
Program Highlights
-
Hands-on training with real-world datasets
-
Industry-relevant case studies
-
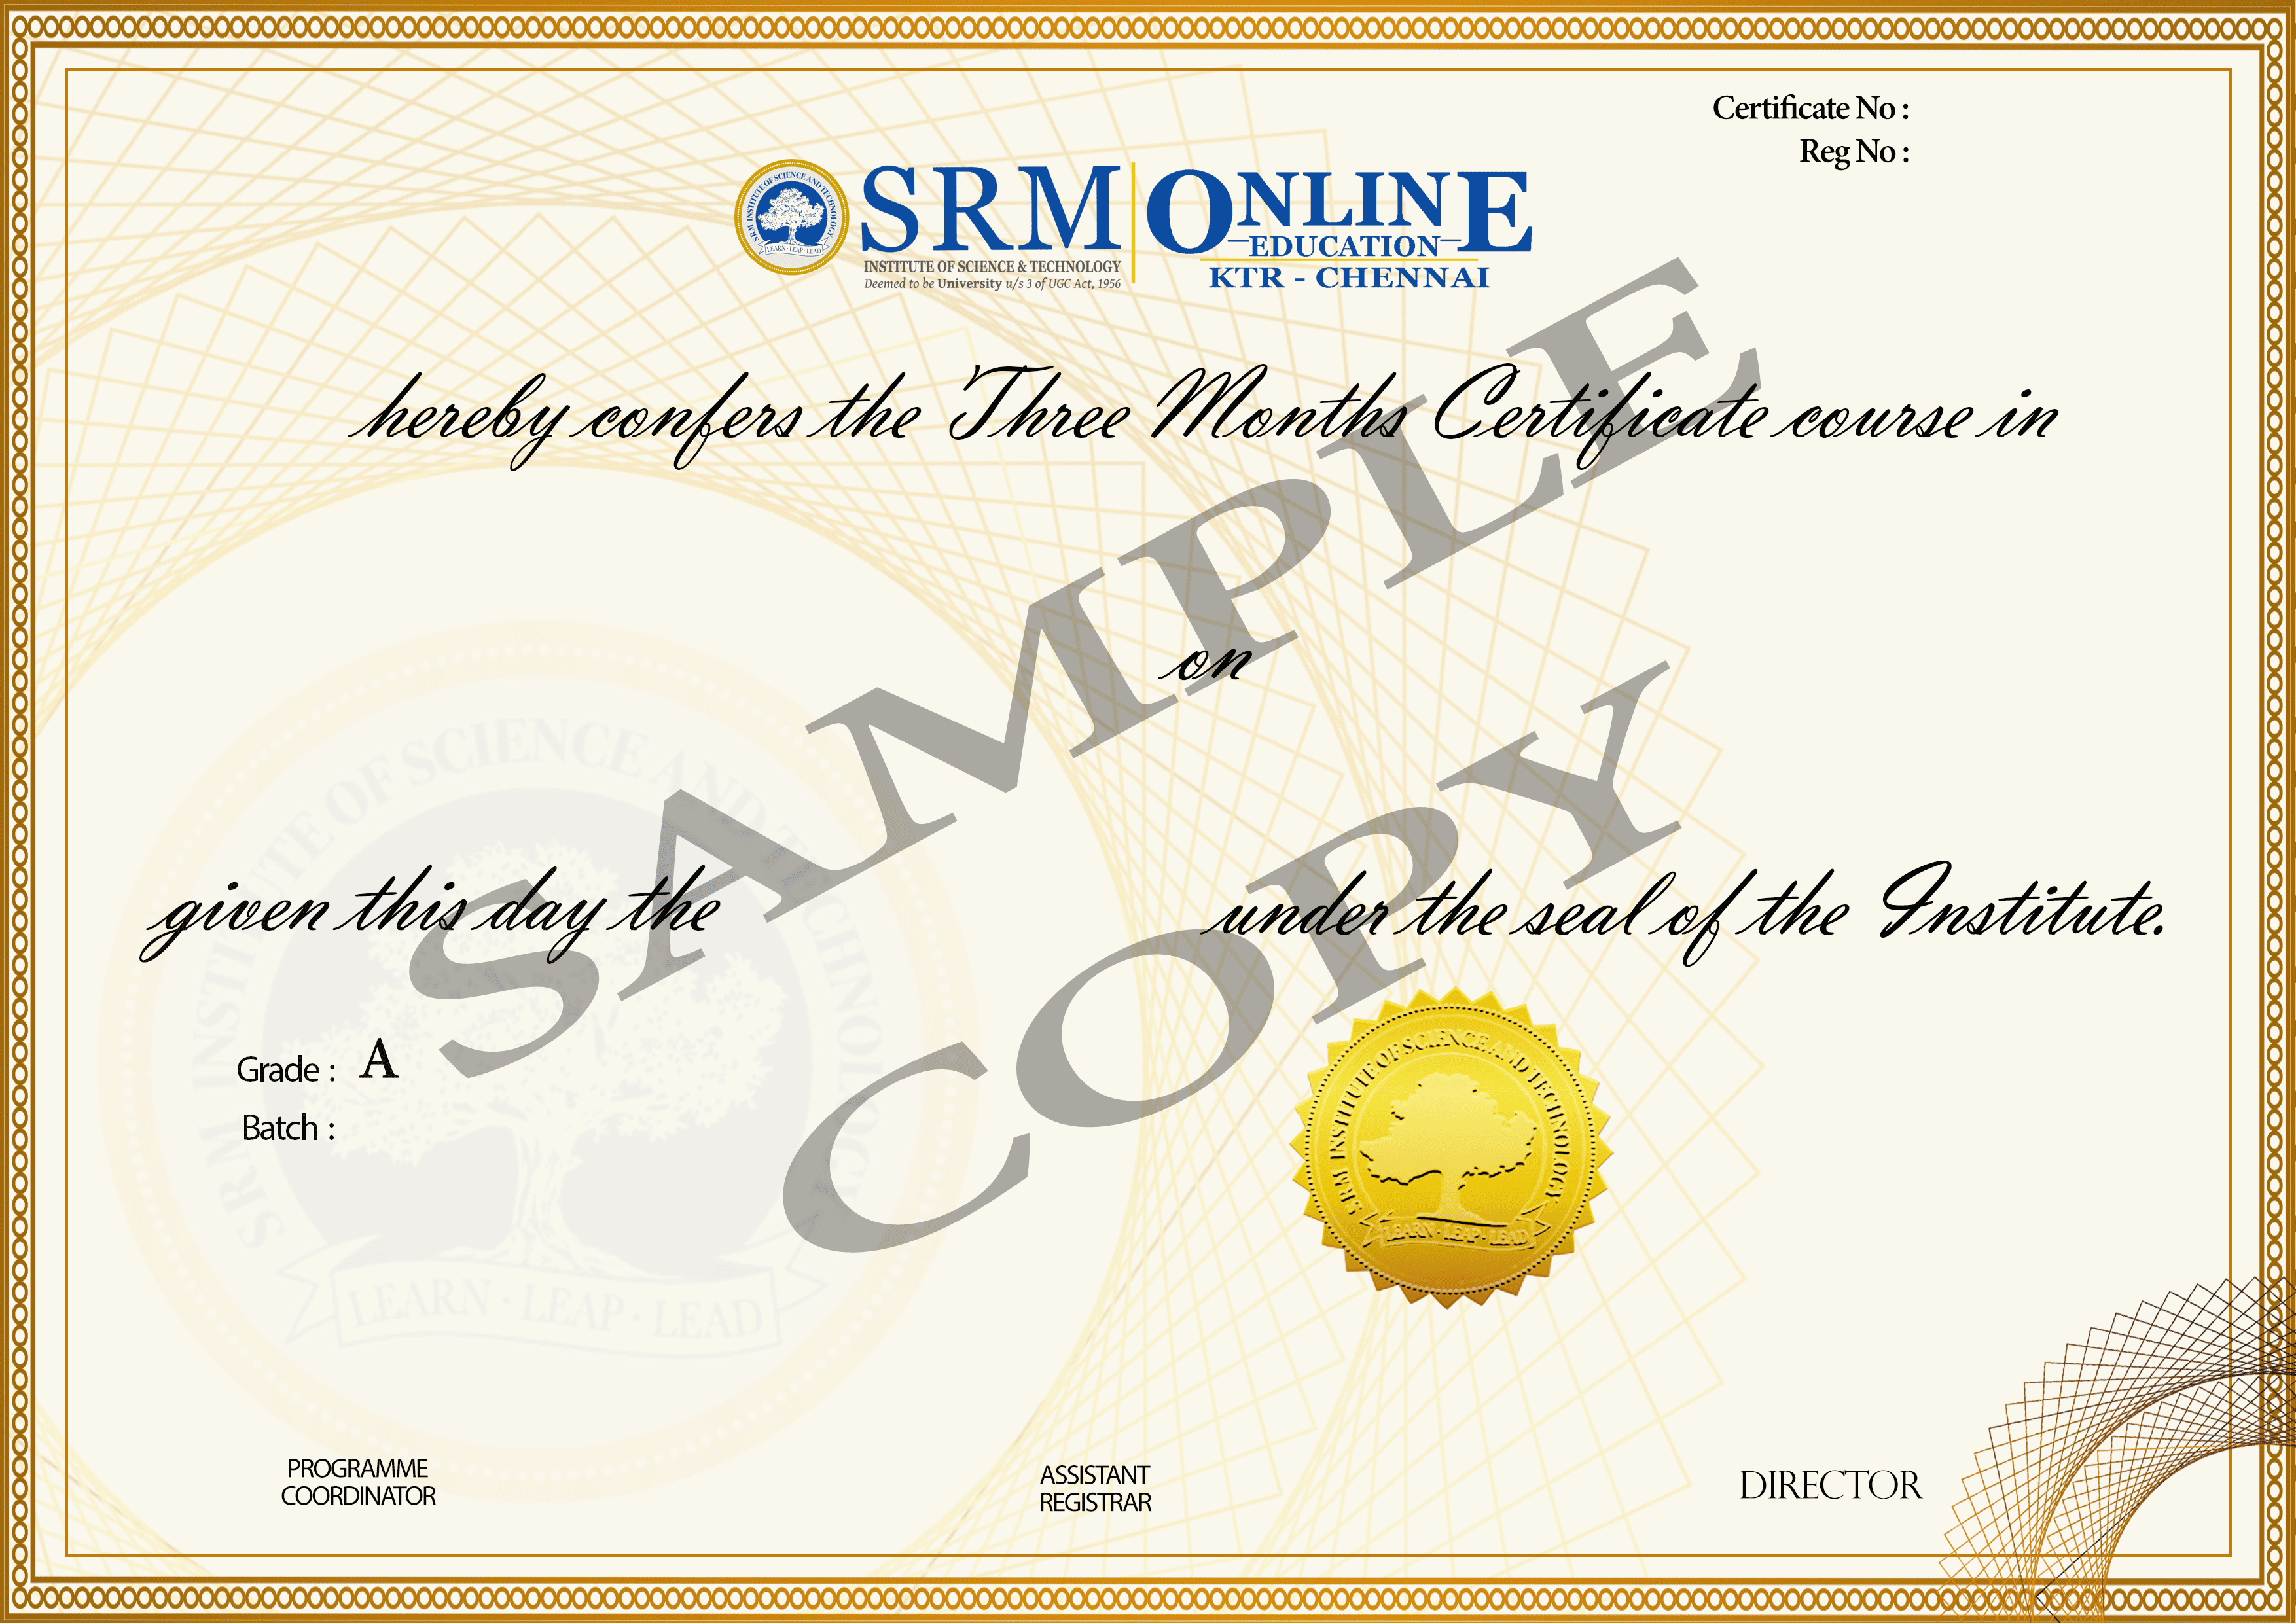
Certification upon successful completion
Program Outcomes
-
Proficiency in Power BI for data analysis
-
Ability to create interactive dashboards
-
Data-driven decision-making skills

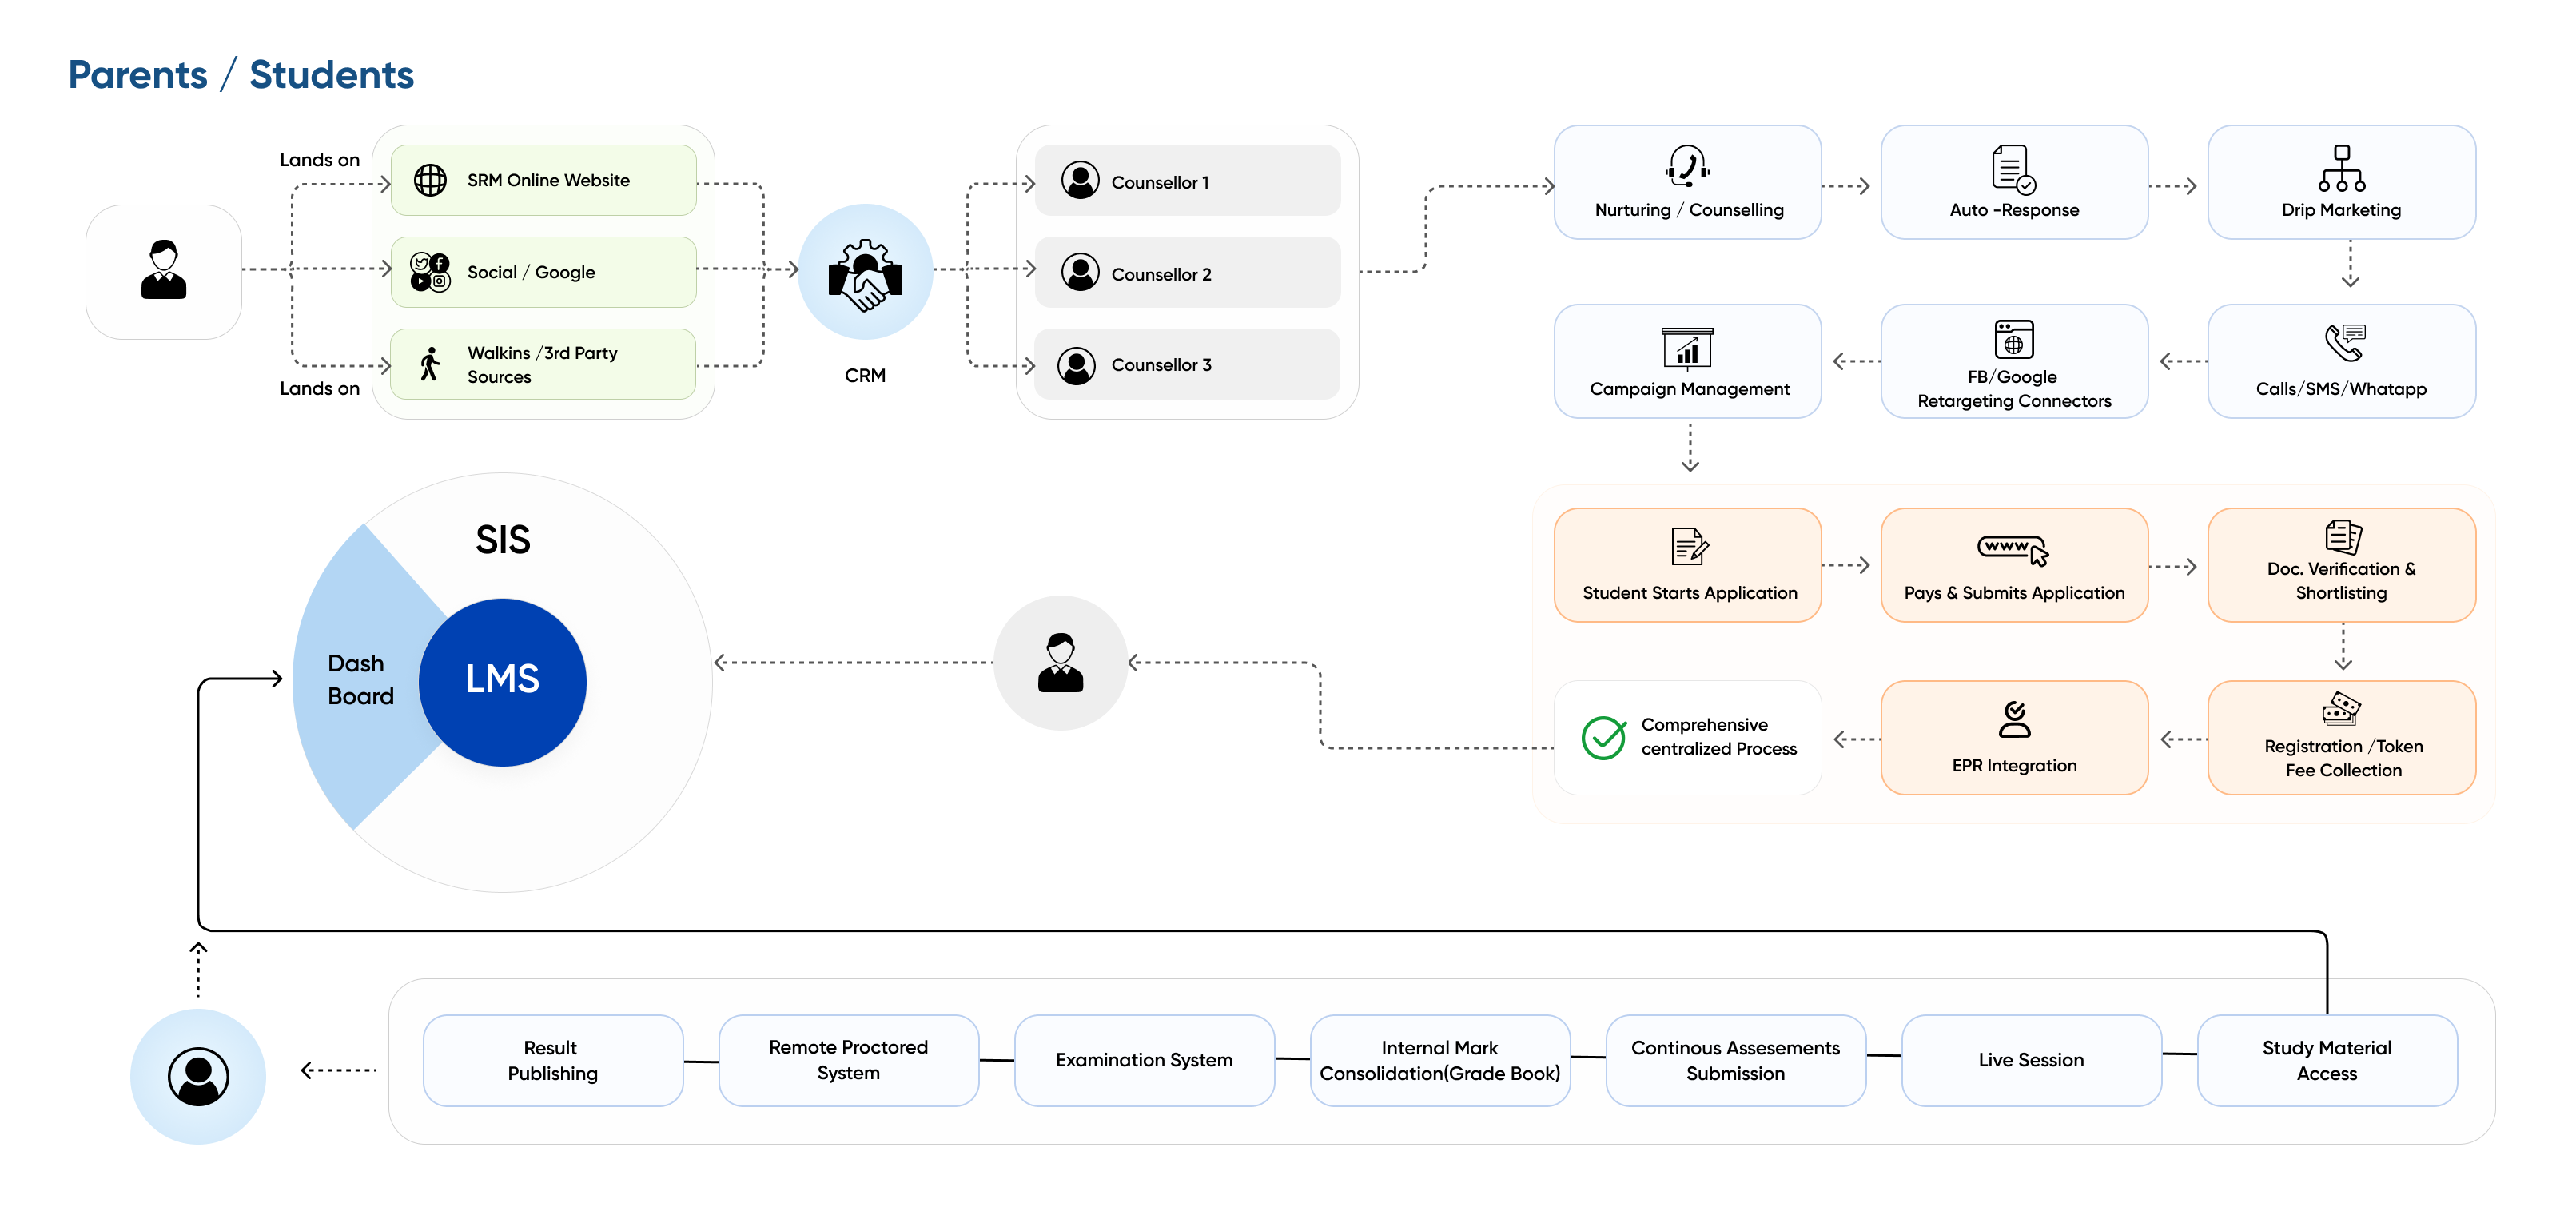
Admission Process
Step - 1
Application submission + Upload of
Step - 2
Selection Process
Step - 3
Selection intimation and fee payment
Step - 4
Formal enrolment of the program


